Define your whole market.
Set your total addressable market geographically. Combine ZIP codes, counties, states, metro areas, or a radius to describe where your business works.
Define where you want to grow. Divide it into sales and service territories. Connect every lead and account to the right people by location.
View buildings alongside territory, service, and lead layers. Explore a small sample of the map controls.
Toggle sample building pins.
Other app layers include territories, franchisees & vendors, completed services, missed services, and leads.1 · Harbor Point Office
Completion recorded2 · Civic Administration
Completion recorded3 · Utilities Office
Missed service · reviewInterface recreation based on JanGuard’s app screens · Fictional sample data · Select the tabs to explore
Switch perspectives, select a district, and explore the map layers. This example shows how geography connects growth and operations.
Interactive product illustration. Sample assignments and schematic boundaries—not live customer data. Map layers can be combined.
Your market tells you where to work. Your territories tell your team who owns the next opportunity—and who takes care of the account.
Set your total addressable market geographically. Combine ZIP codes, counties, states, metro areas, or a radius to describe where your business works.
Divide your market into sales territories and assign representatives to the leads in their area. Put location at the center of ownership.
Organize service territories and assign accounts to the operations people responsible for those locations.
Bring territories, facilities, providers, service activity, and leads into one map. Turn layers on and off to focus on the question at hand.
Build your organization’s geographic coverage with rules that stack together. Then subdivide that coverage into territories your team can own.
Target a defined local footprint.
Organize coverage around county boundaries.
Establish a broader regional presence.
Focus on a connected urban market.
Define reach around a chosen location.
Define the geography of your addressable market. Coverage alone is not a market-size or revenue estimate.
Organize leads geographically so representatives can focus on their assigned market. See nearby opportunities, understand coverage, and keep responsibility connected to location.
Divide operational coverage into manageable areas. Assign accounts to the people responsible for service, and view facilities alongside the activity that needs their attention.
See the geography behind your accounts. Bring buildings, service activity, and opportunities into focus—and find the locations that need a closer look.
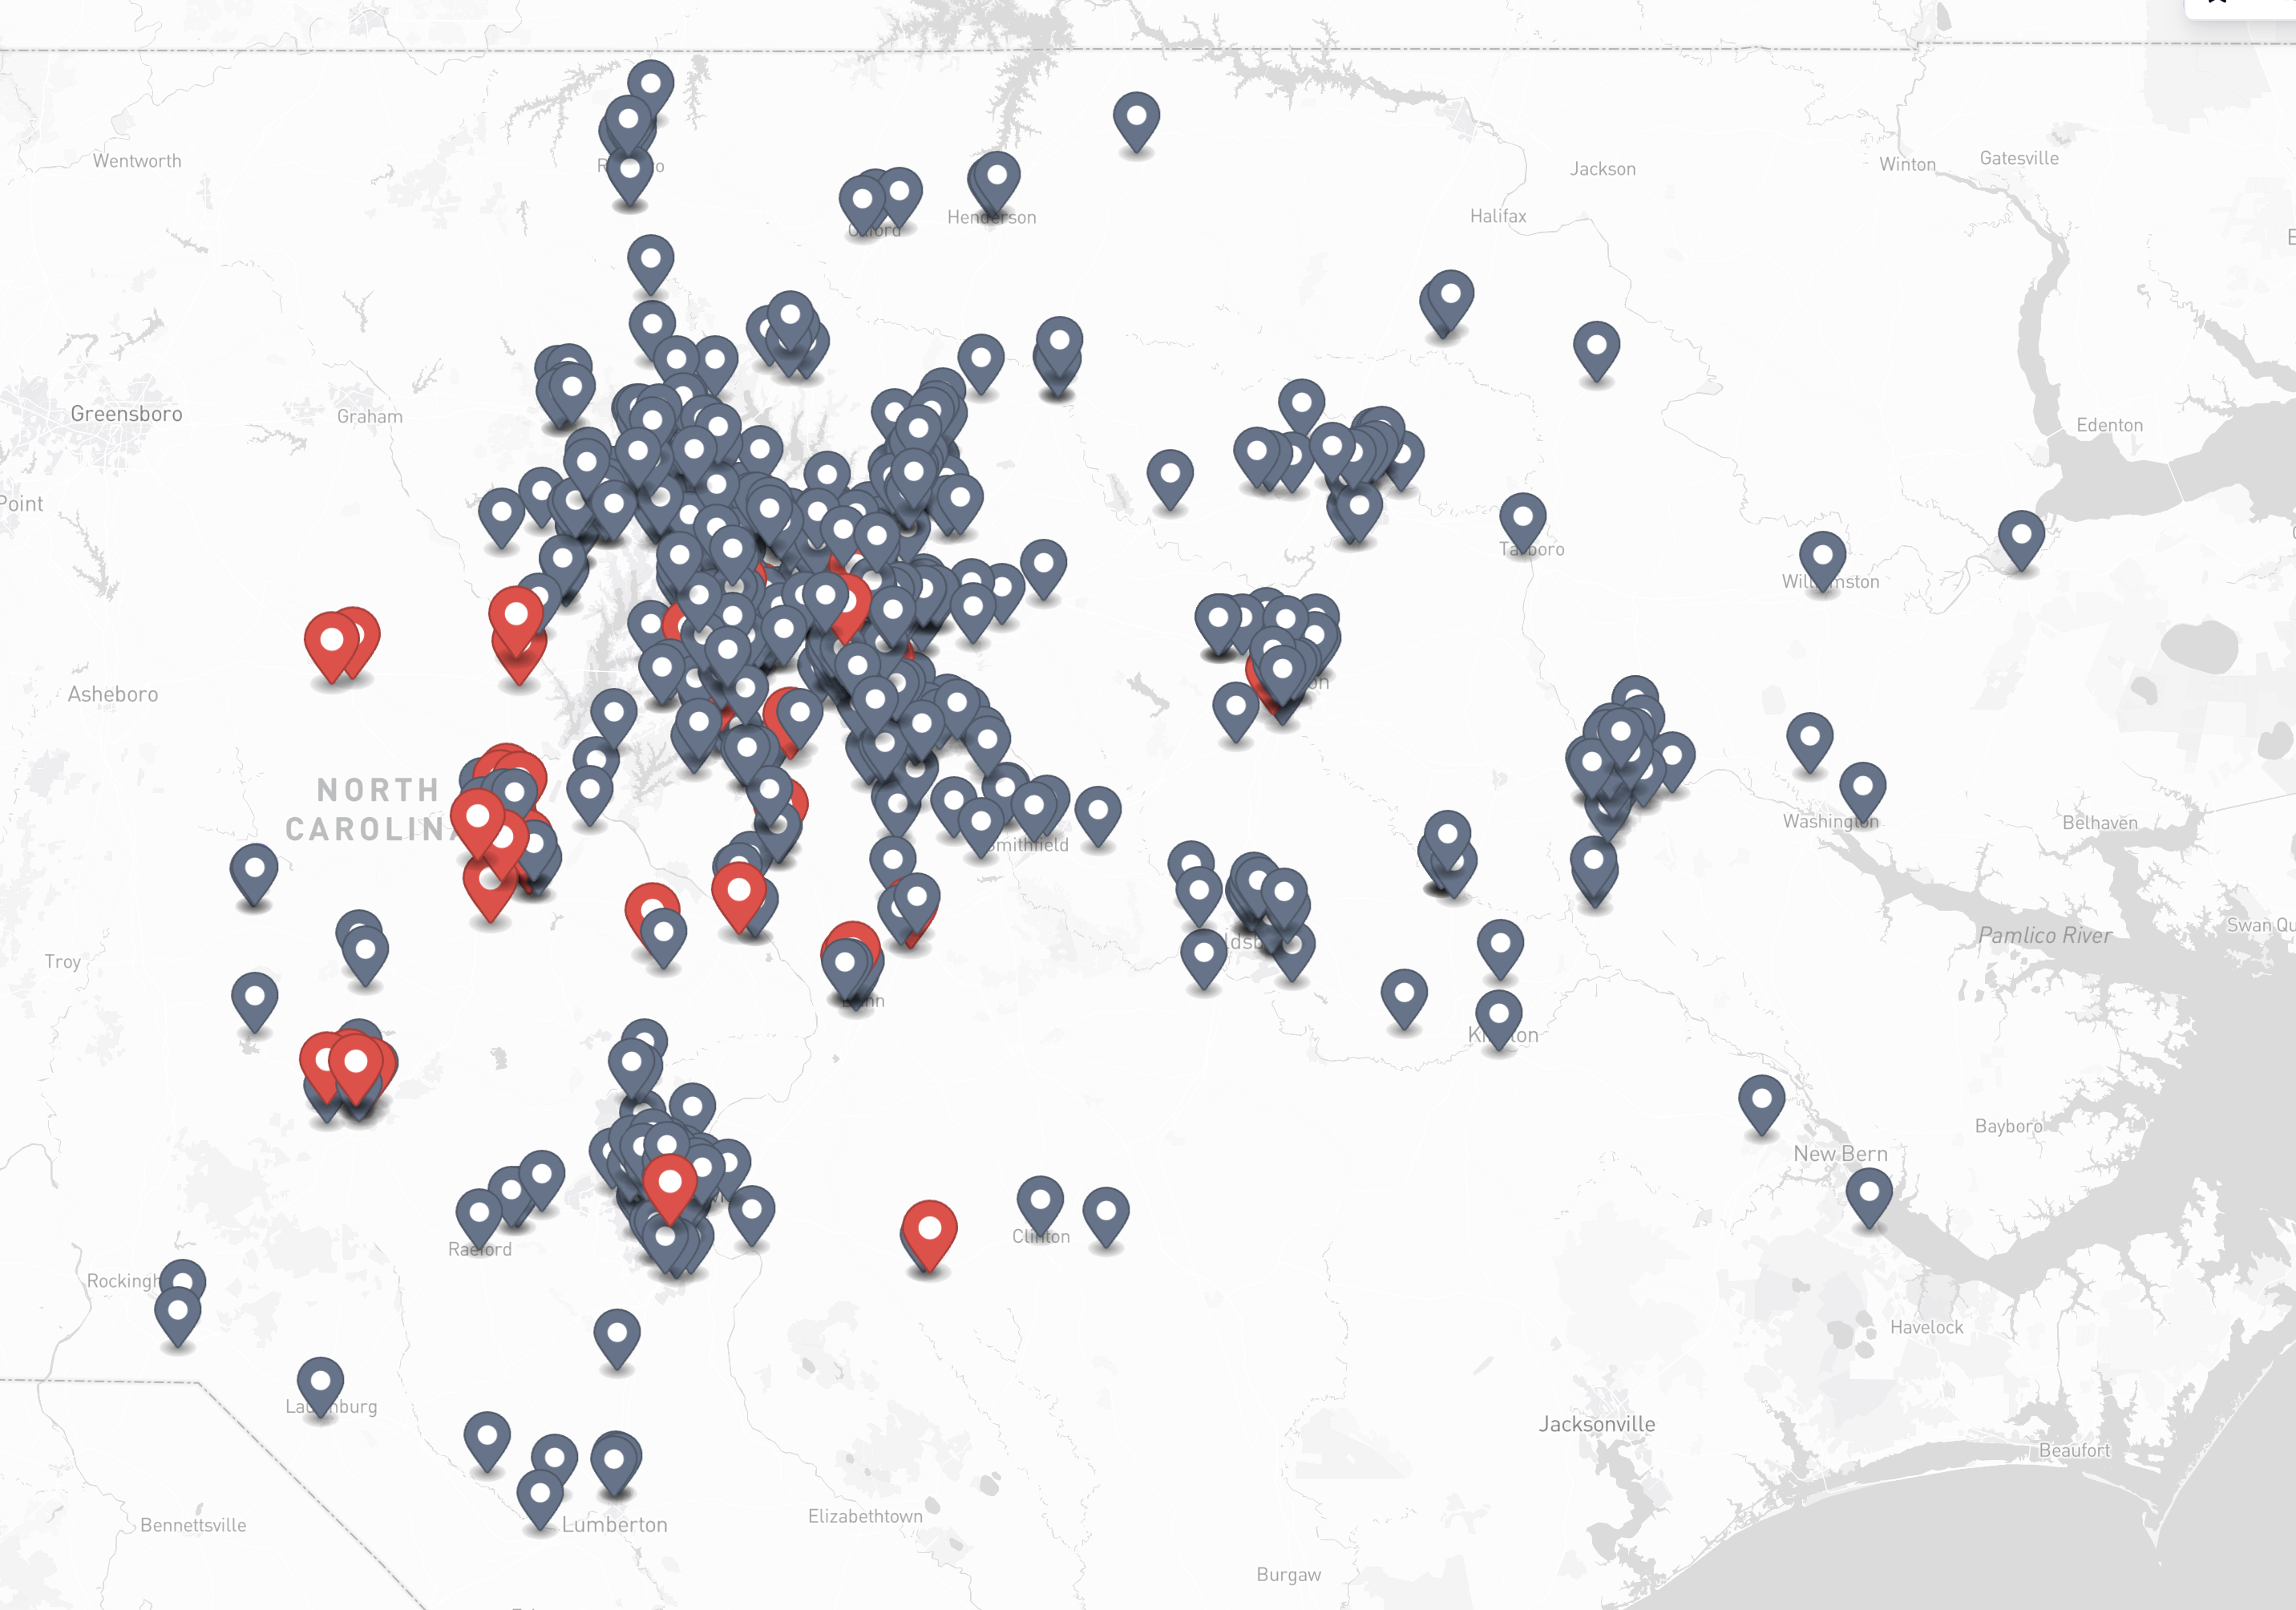
View the facility in context, with its assigned operations owner and surrounding accounts.
Explore workforce visibility →Actual JanGuard map screenshot with interactive zoom and illustrative account overlays. Numbered examples are fictional; background pins are part of the screenshot.
Set geographic coverage using ZIP codes, counties, states, metro areas, or a radius. Coverage rules combine to define your organization’s service area.
Sales territories organize lead ownership for your sales team. Service territories organize account responsibility for operations. Both bring location into how you assign the work.
The map includes layers for territories and TAMs, franchisees and vendors, buildings, completed services, missed services, and leads. Select the layers relevant to your task.
No. A missed or overdue service needs review against the schedule and available service records. Use the map to identify where to investigate.
No. It is an interactive illustration with fictional districts, people, and records. Geographic boundaries and marker positions are schematic. It does not change your JanGuard account.